
Insights for educators
Georgia Ag Impact Report
The Georgia Ag Impact Report provides the state’s agricultural stakeholders the research-backed insights they need to support Georgia’s No. 1 industry. As a national leader in agricultural innovation and outreach, the University of Georgia College of Agricultural and Environmental Sciences (CAES) is proud to empower producers with innovative research to cultivate a stronger, healthier Georgia.

Educators: I am pleased to introduce the Georgia Ag Impact Report, a resource from the University of Georgia that highlights key aspects of Georgia’s leading industry — agriculture.
This report provides real-world data and insights that can seamlessly integrate into your classroom curriculum. The information it presents serves as a valuable springboard for lessons across many subjects, including math, geography, history, language arts, critical thinking and nutrition.
What makes the Georgia Ag Impact Report especially impactful is its connection to real-world information that is relevant to your students. I encourage you to explore this resource and discover ways to inspire your students with lessons rooted in Georgia’s agricultural industry.
Becky Griffin
Community & School Garden Coordinator
Georgia Center for Urban Agriculture
University of Georgia Extension
How to use this report in the classroom

Teaching students about Georgia agriculture connects them to the food they eat and the farms that make it possible.
Understanding agriculture helps students appreciate the connection between science, technology, economics and environmental stewardship. It fosters critical thinking and problem-solving skills as they explore issues like sustainability, food security and the impacts of farming on their daily lives.
Using resources like the Georgia Ag Impact Report and the Georgia Farm Gate Value Report from CAES adds a layer of real-world relevance to these lessons. These reports provide data on the economic contributions of different commodities, the value of farming operations and trends shaping Georgia’s agricultural landscape. Students can analyze the data to understand how agriculture influences their local communities and careers. This encourages data literacy and offers students a chance to see how information gathered by experts can inform policy, business decisions and scientific research.
To bring these concepts to life, educators are welcome to use the lesson plans and activity sheets developed by CAES. Beyond these resources, here are some additional ideas to incorporate Georgia ag data in the classroom:
- Challenge students to create their own infographics or poster boards using key findings from the Georgia Ag Impact Report.
- Have students work in groups (or solo) to research a specific commodity from the report, exploring its production process, economic impact and challenges.
- For younger students, try hands-on activities like planting a mini garden or identifying local crops through maps and field trips.
- For older students, agriculture can be incorporated into a wide variety of classes. Students in a rhetoric or public speaking class might debate current agricultural issues using data from the reports as evidence, while students in a statistics or economics class might analyze trends in farming using math and graphing skills.
- Invite engaging guest speakers from the agricultural sector or arrange tours (in-person or virtual) of farms to give students firsthand insights into the industry.
These methods not only make agriculture education more interactive but also inspire students to consider careers in agriculture, science and beyond.

View data by year, county or commodity
The Georgia Farm Gate Value Report is an annual, county-level economic valuation of food and fiber production in the state. The numbers in this report are estimated by local county UGA Cooperative Extension agents and refined by data analysts from the CAES Department of Agricultural and Applied Economics.
Top Georgia commodities
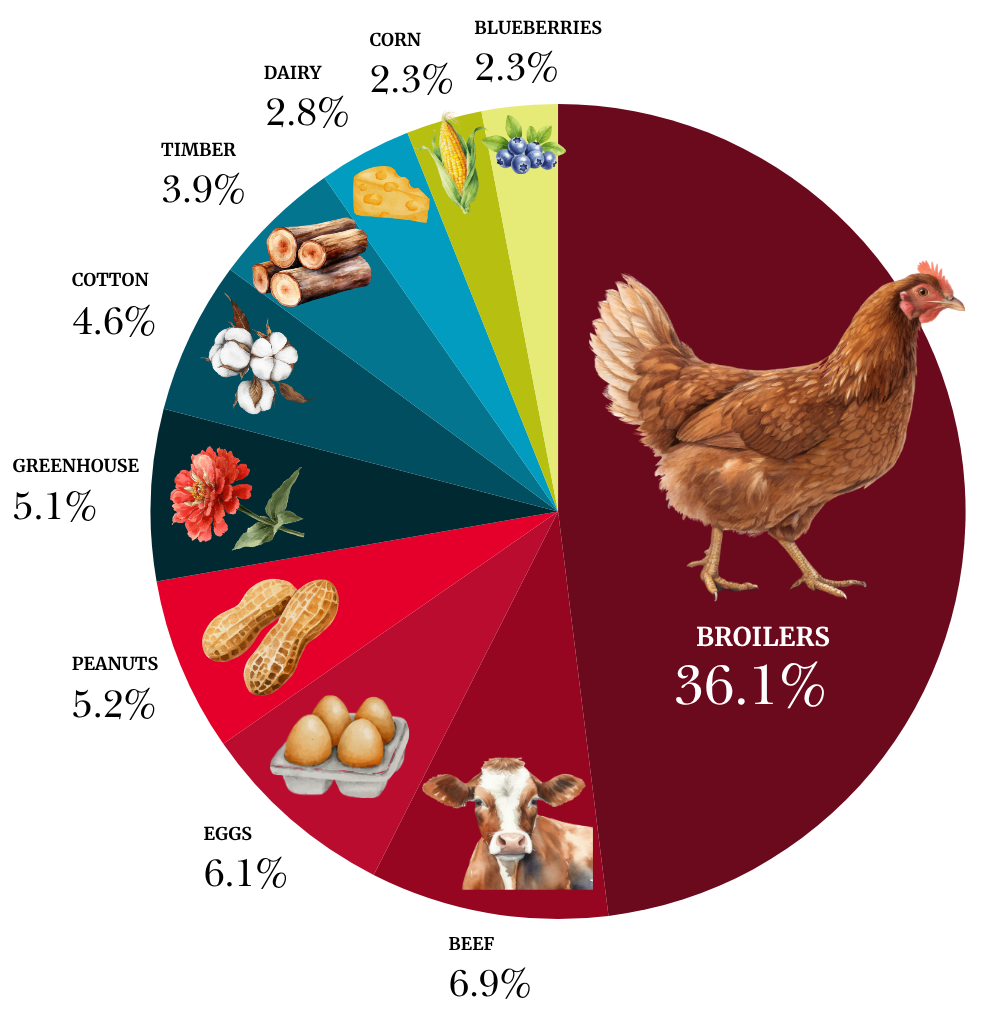
The 2026 Georgia Ag Impact Report data is based on the 2024 Georgia Farm Gate Value Report, an annual county-level economic valuation for all food and fiber production in the state.
Together, Georgia commodities directly represent a value of over $18 billion to the state’s economy. This figure is increased from $17.6 billion in 2023.
In 2024, food and fiber production and related industries supported 370,400 jobs and contributed $100.4 billion to Georgia’s $1.5 trillion in economic output.
Georgia’s top commodities are:
1. Broilers: $6.1 billion | 36.1% of total farm gate value
2. Beef: $1.2 billion | 6.9% of total farm gate value
3. Eggs: $1 billion | 6.1% of total farm gate value
4. Peanuts: $877.9 million | 5.2% of total farm gate value
5. Greenhouse: $863.2 million | 5.1% of total farm gate value
6. Cotton: $770.4 million | 4.6% of total farm gate value
7. Timber: $655.6 million | 3.9% of total farm gate value
8. Dairy: $469.3 million | 2.8% of total farm gate value
9. Corn: $382.8 million | 2.3% of total farm gate value
10. Blueberries: $382.7 million | 2.3% of total farm gate value


Lesson plan
Exploring Georgia’s ag impact
Grade Level: 6th-12th Grade
Subject Areas: Science, Social Studies, Mathematics, Economics
Duration: 1-2 class periods (45-60 minutes each)
Standards Alignment: This lesson aligns with standards in economics (understanding regional industries), science (sustainability and ecosystems) and mathematics (data analysis and interpretation).
Objective
Students will explore the Georgia Ag Impact Report to understand the economic, environmental and social impact of agriculture in Georgia. They will analyze data, identify key agricultural commodities and connect agriculture to real-world issues and career opportunities.
Materials needed
- Copies of the Georgia Ag Impact Report
- Projector or smartboard for visuals
- Student handouts with activity instructions (e.g., charts, maps, graphs)
- Access to the internet (optional for extended research)
- Sticky notes, markers and poster paper (optional for group work)

Lesson outline
1. Introduction (10 minutes)
- Start with an engaging question: “What’s your favorite food, and do you know where it comes from?”
- Show a short video or infographic about Georgia agriculture’s economic and cultural importance.
- Briefly introduce the Georgia Ag Impact Report and its purpose.
2. Guided exploration (15–20 minutes)
- Distribute copies of the report or direct students to the digital version.
- Divide the class into small groups and assign each group a section or commodity from the report (e.g., poultry, peanuts, forestry).
- Each group should identify key data points (e.g., economic contributions, trends or production figures), discuss why their assigned commodity is important to Georgia, and identify at least one challenge or opportunity related to their commodity.
3. Group activity (15–20 minutes)
Option 1: Data visualization
- Students create a bar graph, pie chart or infographic using the data from their section of the report.
- Each group presents their visual to the class.
Option 2: Community connection
- Students map their local area, identifying nearby farms or industries that connect to Georgia’s top commodities.
- Groups discuss how agriculture impacts their community.
4. Wrap-up discussion (10 minutes)
- Reconvene as a class to share key insights from each group.
- Facilitate a discussion on how agriculture connects to larger global challenges like food security, climate change or sustainability.
- Encourage students to ask questions and reflect on how agriculture affects their daily lives.

Assessment:
- Participation in group activities and presentations.
- Completion of visual aids (graphs, charts, maps).
- A short reflective paragraph on what they learned about Georgia agriculture and its impact.
Extensions:
- Invite a guest speaker from the agriculture industry to talk about their work.
- Assign a research project where students investigate a lesser-known Georgia commodity.
- Conduct a class debate on a current agricultural issue (e.g., water use, sustainable farming).
Student activity sheets

Color Georgia’s top commodities!

Learn Georgia ag vocab!
View customized reports and data overviews for select audiences below.


Thank you so much for reading the Georgia Ag Impact Report.
For more insights and key takeaways, please visit the 2026 Georgia Ag Forecast annual publication.